Local Management enables a range of savings that traditional centralized tools can’t deliver
When the network and dependent systems are down, orders can’t be placed, employees are less productive, and costly resources have to be diverted to fix problems. Traditional centralized network and system management tools—although good at collecting and reporting system data—still do not proactively fix problems once they occur. The result is that people are still required to perform most of the work over console servers on remote networks.
Understanding the business case for remote network support is based on a risk/return calculation that takes into account the cost of downtime compared to the mix of resources spent to avoid downtime. The following chart shows that how much you spend on your resource mix doesn’t always equate to the lowest risk.
Determining where to invest– Managing network cost & risk
The key is in defining the resource mix:
- Automation | Whether scripts that run over the network, or the automated management and recovery processes deployed by Uplogix, automation saves human effort, and reduces risk by taking human error out of the equation.
- Monitoring Software | Software that uses SNMP polling to monitor a wide variety of network and device statistics. Reliant on a network connection to the equipment and networks it monitors.
- Console/OOB | Connecting remotely to devices over the console port, providing base-level access for management. Out-of-band (OOB) access is an alternate path to connect to equipment other than the primary network.
- Onsite IT Staff | Trained people. Whether direct employees or through break/fix contracts, this is the cost of assigning a human to solve a problem at a site. Along with high costs come issues like lack of coverage during night or holiday hours, plus the possibility of travel costs if they are unable to access a site remotely.
Running the numbers
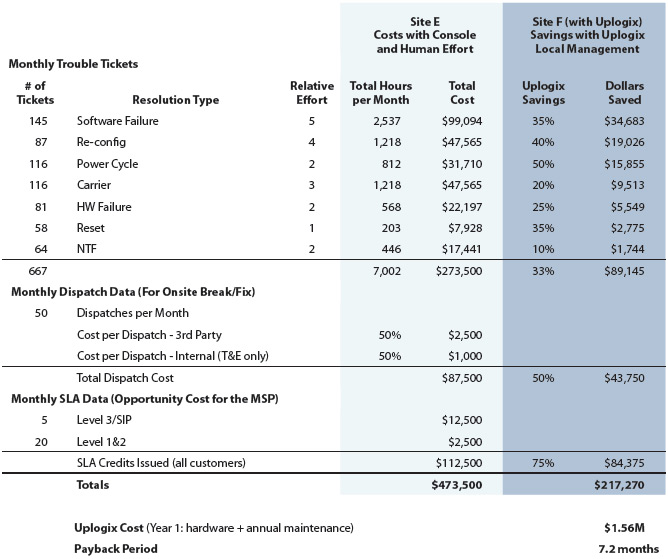
For companies administering their own networks, quantifying downtime is more than just the infrastructure management costs (both planned and unplanned), but also the opportunity costs of the network being down (again, both planned and unplanned). In this example we’ll use statistics provided by an Uplogix customer that is a managed service provider (MSP), because the cost of network downtime is so clearly articulated by SLAs with their customers. Some of the categories listed represent an aggregated cost. For a more detailed analysis with your specific costs, please contact Uplogix.
Starting Assumptions
| Sites: 1,000 | Devices per site: 4 | |
| “Real” Tickets per Device per Year: 2.0 (not alerts, tickets after ECA tools) | Tickets per month: 667 | |

Make your own calculations
There is a confidential ROI calculator available on the Uplogix website.
It allows you to input your own data on things like the number of sites and devices, cost of managing those devices (both scheduled and unscheduled), as well as your own expectations for the value delivered by Uplogix. Just go to: www.uplogix.com/roi